Tutorial
1. Import CellRefiner and packages
[2]:
import numpy as np
import seaborn as sns
from matplotlib import pyplot as plt
import scanpy as sc
import cellrefiner as cr
2. Load Data
The paired datasets here are from Visium spatial transcriptomic data and scRNA-seq samples of the mouse cortex available via the squidpy package.
[4]:
import squidpy as sq
adata_st = sq.datasets.visium_fluo_adata_crop()
adata_st = adata_st[adata_st.obs.cluster.isin([f"Cortex_{i}" for i in np.arange(1, 5)])].copy()
adata_sc = sq.datasets.sc_mouse_cortex()
print(adata_st)
print(adata_sc)
/home/kxy/miniconda3/envs/cr_39_1/lib/python3.9/site-packages/xarray_schema/__init__.py:1: UserWarning: pkg_resources is deprecated as an API. See https://setuptools.pypa.io/en/latest/pkg_resources.html. The pkg_resources package is slated for removal as early as 2025-11-30. Refrain from using this package or pin to Setuptools<81.
  from pkg_resources import DistributionNotFound, get_distribution
/home/kxy/miniconda3/envs/cr_39_1/lib/python3.9/site-packages/numba/core/decorators.py:246: RuntimeWarning: nopython is set for njit and is ignored
  warnings.warn('nopython is set for njit and is ignored', RuntimeWarning)
AnnData object with n_obs × n_vars = 324 × 16562
    obs: 'in_tissue', 'array_row', 'array_col', 'n_genes_by_counts', 'log1p_n_genes_by_counts', 'total_counts', 'log1p_total_counts', 'pct_counts_in_top_50_genes', 'pct_counts_in_top_100_genes', 'pct_counts_in_top_200_genes', 'pct_counts_in_top_500_genes', 'total_counts_MT', 'log1p_total_counts_MT', 'pct_counts_MT', 'n_counts', 'leiden', 'cluster'
    var: 'gene_ids', 'feature_types', 'genome', 'MT', 'n_cells_by_counts', 'mean_counts', 'log1p_mean_counts', 'pct_dropout_by_counts', 'total_counts', 'log1p_total_counts', 'n_cells', 'highly_variable', 'highly_variable_rank', 'means', 'variances', 'variances_norm'
    uns: 'cluster_colors', 'hvg', 'leiden', 'leiden_colors', 'neighbors', 'pca', 'spatial', 'umap'
    obsm: 'X_pca', 'X_umap', 'spatial'
    varm: 'PCs'
    obsp: 'connectivities', 'distances'
AnnData object with n_obs × n_vars = 21697 × 36826
    obs: 'sample_name', 'organism', 'donor_sex', 'cell_class', 'cell_subclass', 'cell_cluster', 'n_genes_by_counts', 'log1p_n_genes_by_counts', 'total_counts', 'log1p_total_counts', 'pct_counts_in_top_50_genes', 'pct_counts_in_top_100_genes', 'pct_counts_in_top_200_genes', 'pct_counts_in_top_500_genes', 'total_counts_mt', 'log1p_total_counts_mt', 'pct_counts_mt', 'n_counts'
    var: 'mt', 'n_cells_by_counts', 'mean_counts', 'log1p_mean_counts', 'pct_dropout_by_counts', 'total_counts', 'log1p_total_counts', 'n_cells', 'highly_variable', 'highly_variable_rank', 'means', 'variances', 'variances_norm'
    uns: 'cell_class_colors', 'cell_subclass_colors', 'hvg', 'neighbors', 'pca', 'umap'
    obsm: 'X_pca', 'X_umap'
    varm: 'PCs'
    obsp: 'connectivities', 'distances'
3. Run cellrefiner cell to spot mapping and spatial refinement
Load the ligand-receptor database sourced from CellChat
[ ]:
db_lr = cr.pp.ligand_receptor_database()
adata_cr = cr.pp.spatial_mapping(adata_st,adata_sc,db_lr,cluster_key_sc = 'cell_subclass')
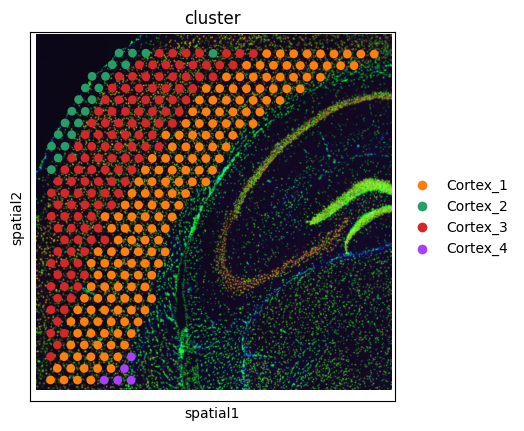
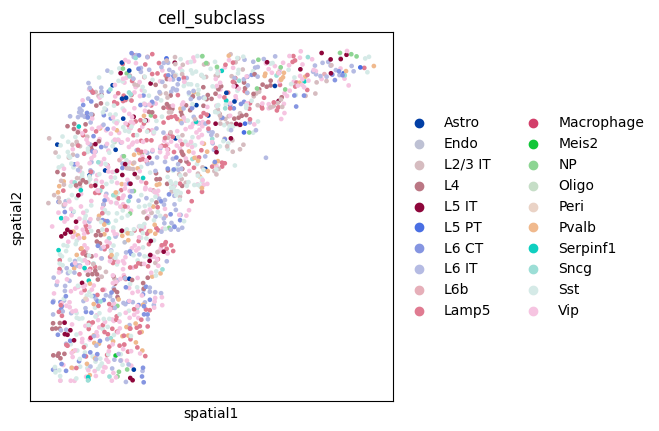
[6]:
sc.pl.spatial(adata_st, color = 'cluster')
sc.pl.spatial(adata_cr, color = 'cell_subclass',spot_size = 100)
4. Cell shape modeling
[7]:
sem = cr.tl.cell_shape_modeling(adata_cr,cluster_key = 'cell_subclass')
Simulation:   0%|          | 0/2000 [00:00<?, ?it/s]/home/kxy/miniconda3/envs/cr_39_1/lib/python3.9/site-packages/numba/cuda/dispatcher.py:536: NumbaPerformanceWarning: Grid size 85 will likely result in GPU under-utilization due to low occupancy.
  warn(NumbaPerformanceWarning(msg))
Simulation: 100%|██████████| 2000/2000 [00:26<00:00, 75.41it/s]
add .obsp['contacts'], .uns['contacts']
Computing alpha-shape with parameters: alpha=None, ns=10, r=1.2
Processing Cell Shapes: 100%|██████████| 1620/1620 [00:14<00:00, 109.03it/s]
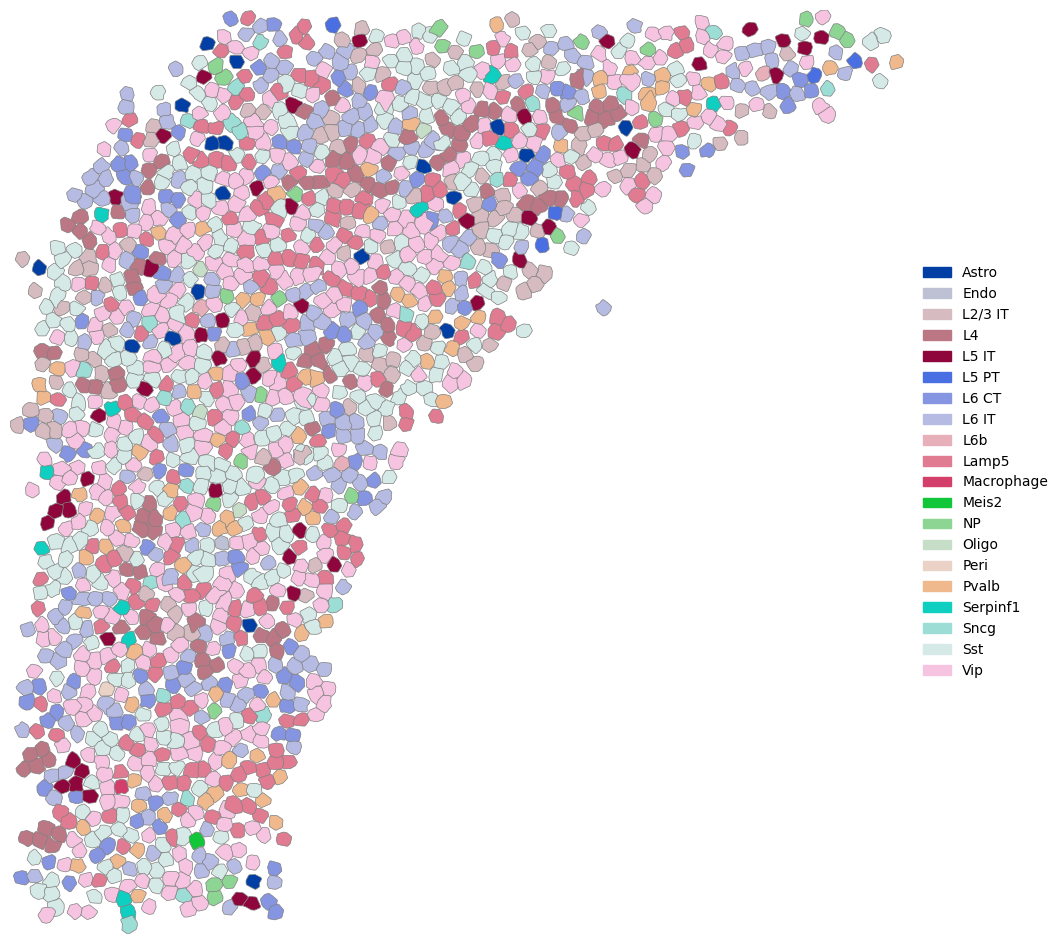
[8]:
fig,ax=plt.subplots(figsize=(12,12))
cr.pl.plot_cell_shape(sem,ax=ax,boundary_color='gray',boundary_width=0.5)
[8]:
<Axes: >
5. Contact-based communication analysis
[9]:
db_lr = cr.pp.ligand_receptor_database(signaling_types='Cell-Cell Contact')
db_lr = cr.pp.filter_lr_database(db_lr,adata_cr, min_cell_pct=0.01)
cr.tl.contact_communication(db_lr, adata = adata_cr)
add .uns['contact_signal_info']
add .obsm['sender_signal'], .obsm['receiver_signal']
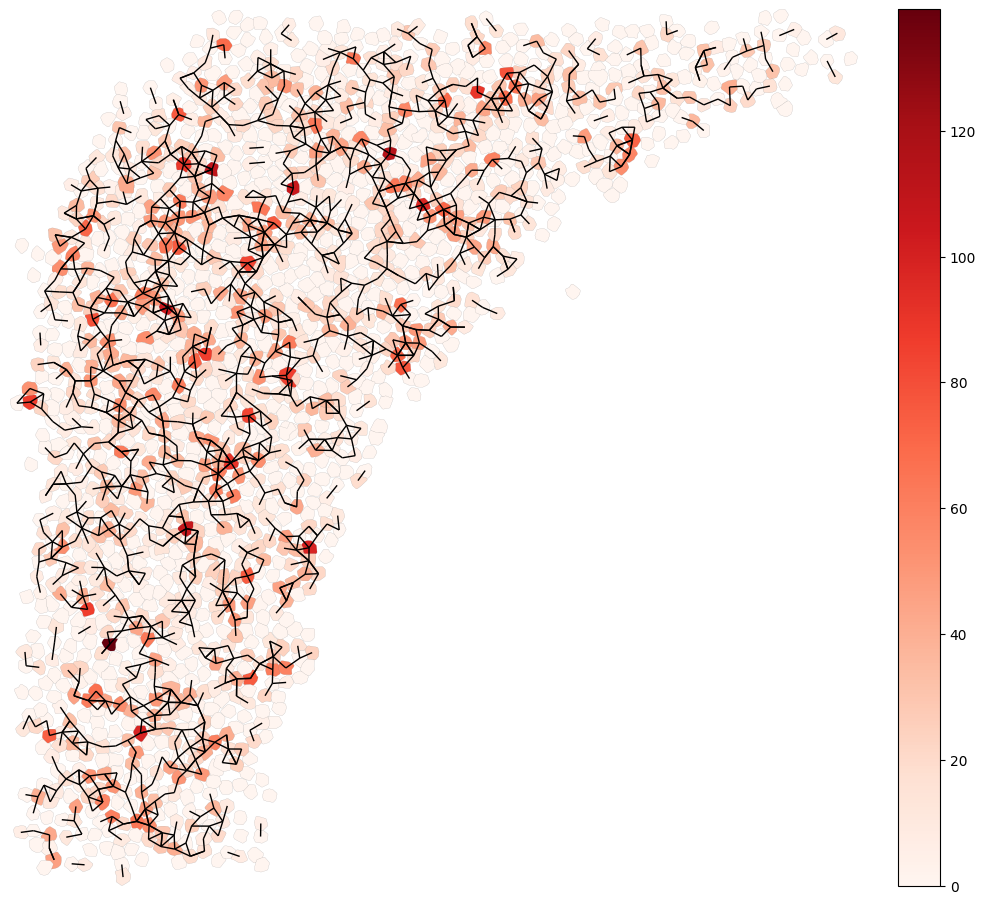
[10]:
fig,ax=plt.subplots(figsize=(12,12))
cr.pl.plot_cell_shape(sem,ax=ax,vis_key='NOTCH',boundary_color='gray',boundary_width=0.1)
cr.pl.plot_contact_signal(sem,ax=ax,signal = 'NOTCH')
[10]:
<Axes: >
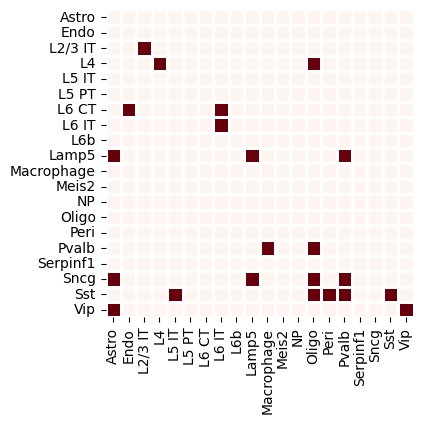
Cluster-level communication
[11]:
cr.tl.cluster_communication(adata_cr,cluster_key = 'cell_subclass',signal = 'NOTCH')
fig,ax=plt.subplots(figsize=(6,4))
sns.heatmap(adata_cr.uns[f'cell_subclass-NOTCH']['communication_pvalue']<0.05,square=True,linewidths=1,ax=ax,cmap='Reds',cbar=False)
[11]:
<Axes: >
Visualize all contact-based communications
[12]:
fig,ax=plt.subplots(figsize=(12,12))
cr.pl.plot_cell_shape(sem,ax=ax,boundary_color='gray',boundary_width=0.5,save_name = 'cell_shape.png')
plt.close(fig)

# plot all pathway
summary = 'sender'
for pth in adata_cr.uns['contact_signal_info']['pathway']:
    fig,ax=plt.subplots(figsize=(12,12))
    if summary == 'cell':
        cr.pl.plot_cell_shape(sem,boundary_color='gray',boundary_width=0.4,ax=ax,enable_colorbar=False,enable_legend=True)
    else:
        cr.pl.plot_cell_shape(sem,vis_key=pth,summary=summary,boundary_color='gray',cmap_name='Reds',boundary_width=0.4,ax=ax,enable_colorbar=True)
    cr.pl.plot_contact_signal(sem,signal=pth,line_color = 'k', line_width=0.8, ax=ax, line_alpha=0.8)
    ax.set_axis_off()
    fig.savefig(f"{pth}_{summary}.png", dpi=500, bbox_inches='tight')
    plt.close(fig)
[13]:
for sig_key in adata_cr.uns['contact_signal_info']['pathway']:
    cr.tl.cluster_communication(adata_cr,'cell_subclass',sig_key)
[14]:
# cluster-level
for pth in adata_cr.uns['contact_signal_info']['pathway']:
    fig,ax=plt.subplots(figsize=(6,4))
    sns.heatmap(adata_cr.uns[f'cell_subclass-{pth}']['communication_pvalue']<0.05,square=True,linewidths=1,ax=ax,cmap='Reds',cbar=False)
    fig.savefig(f"{pth}_significance.png", dpi=500, bbox_inches='tight')
    plt.close(fig)